




BNB price rallied more than 5% before sellers halted the advance near $600, leaving the token at about $590 on July 31 as traders assessed whether its breakout can hold.
Summary
- BNB price climbed above $590 after breaking a descending trendline that had capped price for about 45 days.
- The daily price moved above the Bollinger Band’s $587.85 upper boundary, signaling strong but stretched momentum.
- A 3-day liquidation heatmap shows major liquidity clusters near $580 and $605–$610.
- 4-hour RSI remains bullish at 65.14, while the MACD continues to favor buyers.
BNB price action today
According to data from crypto.news, BNB (BNB) price surged from the $570 area and reached an intraday high near $595 before easing to approximately $590 at the time shown on the charts. The move carried the token out of the narrow range that had controlled trading during the second half of July.
The 4-hour chart shows a sharp breakout candle above $575, followed by an extension toward $595. Buyers have since defended the $586–$590 region, although several upper wicks near $595 show that sellers remain active below the psychological $600 level.
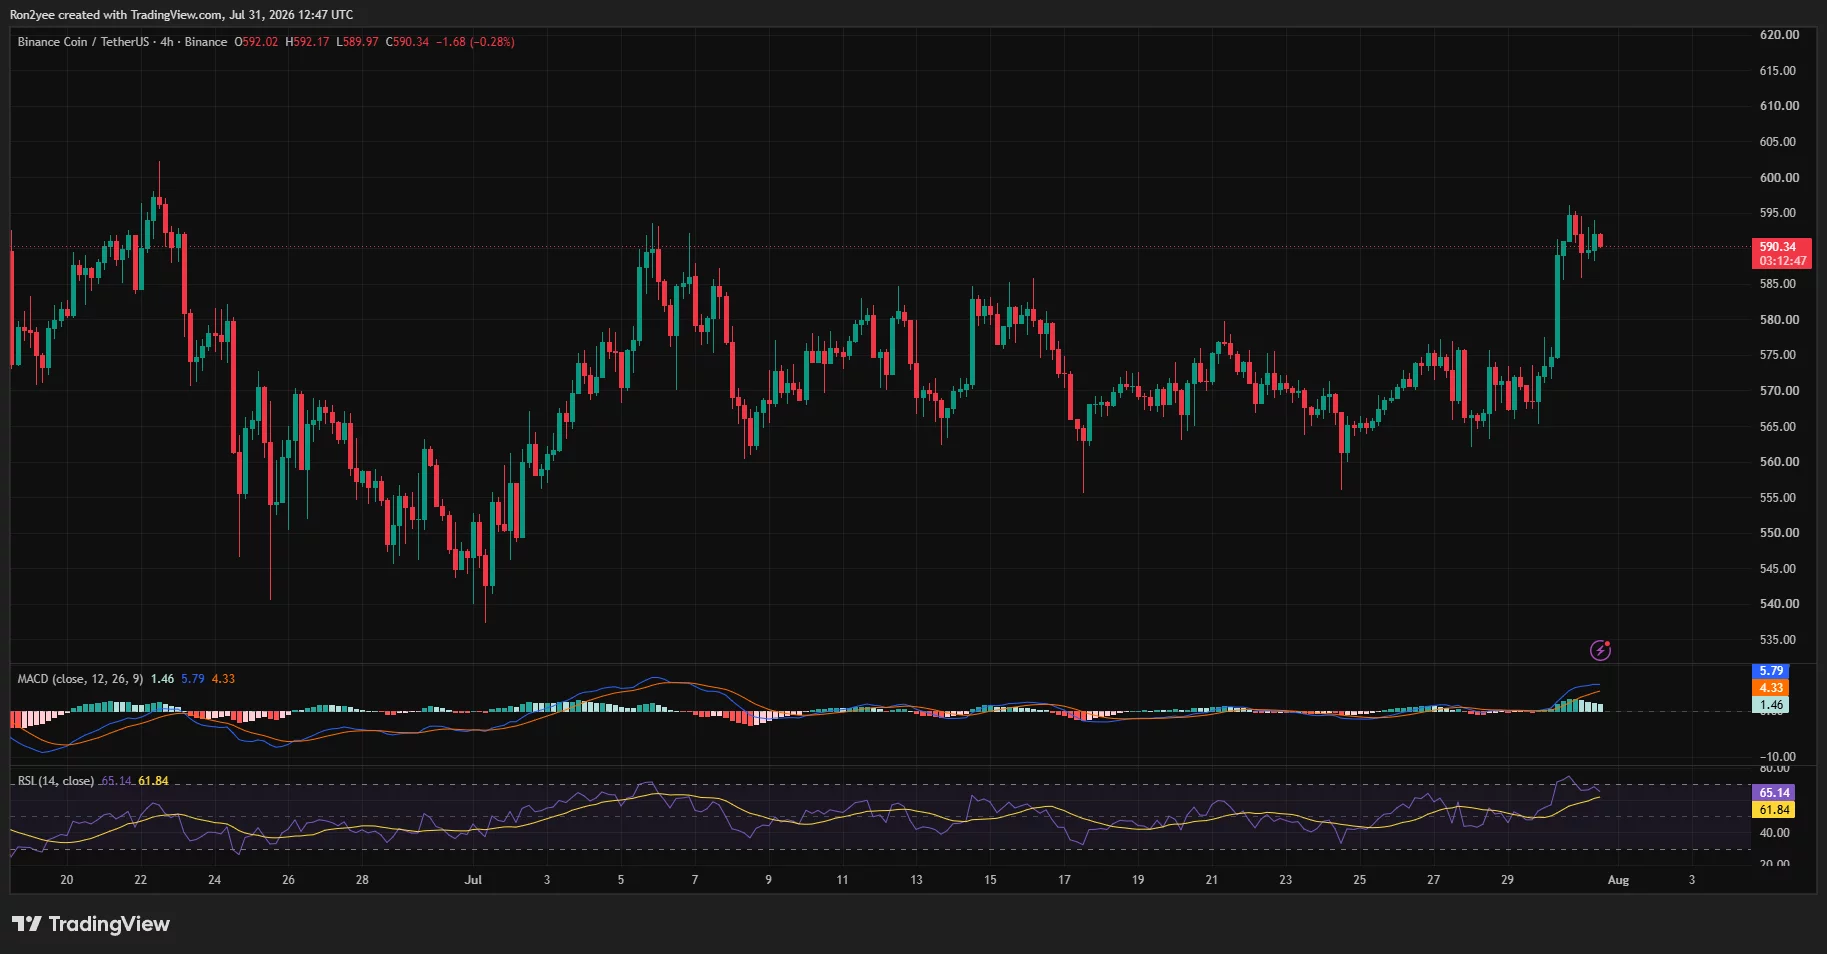
BNB has tested this broader resistance area several times since June. Price reached nearly $598 on June 22 and approached $594 in early July, but neither attempt produced a sustained move above $600.
The latest breakout is stronger than the previous tests because it followed a period of higher lows around $560–$570. However, BNB must still close above $600 to confirm that the wider consolidation has ended.
What is driving the BNB move?
Technical positioning appears to be the immediate driver. BNB broke above a descending resistance line that had connected lower highs since the token traded near $632 in mid-June.
Analyst Hanah described the move as a possible change in short-term momentum after 45 days of downward pressure.
“If BNB can hold above the breakout level, it could pave the way for a stronger bullish continuation.”
Network activity has also provided a fundamental backdrop for the recovery. BNB Chain reportedly processed about $19 billion in weekly decentralized exchange volume, placing it ahead of Ethereum and Solana during the measured period. Network utilization also rose from roughly 17% to nearly 30%.
SilentSwap’s integration added another use case by bringing private cross-chain swaps to the ecosystem. Rising transactions and gas usage may support demand for BNB, which users need to pay fees across BNB Chain.
Still, those developments do not guarantee that price will clear $600. The immediate rally remains heavily influenced by technical positioning and liquidity concentrated around nearby resistance.
BNB indicators favor buyers but show stretched conditions
BNB closed near $590.15 on the daily chart, above the Bollinger Band’s upper boundary at $587.85. The middle band sits at $573.53, while the lower band is near $559.21.
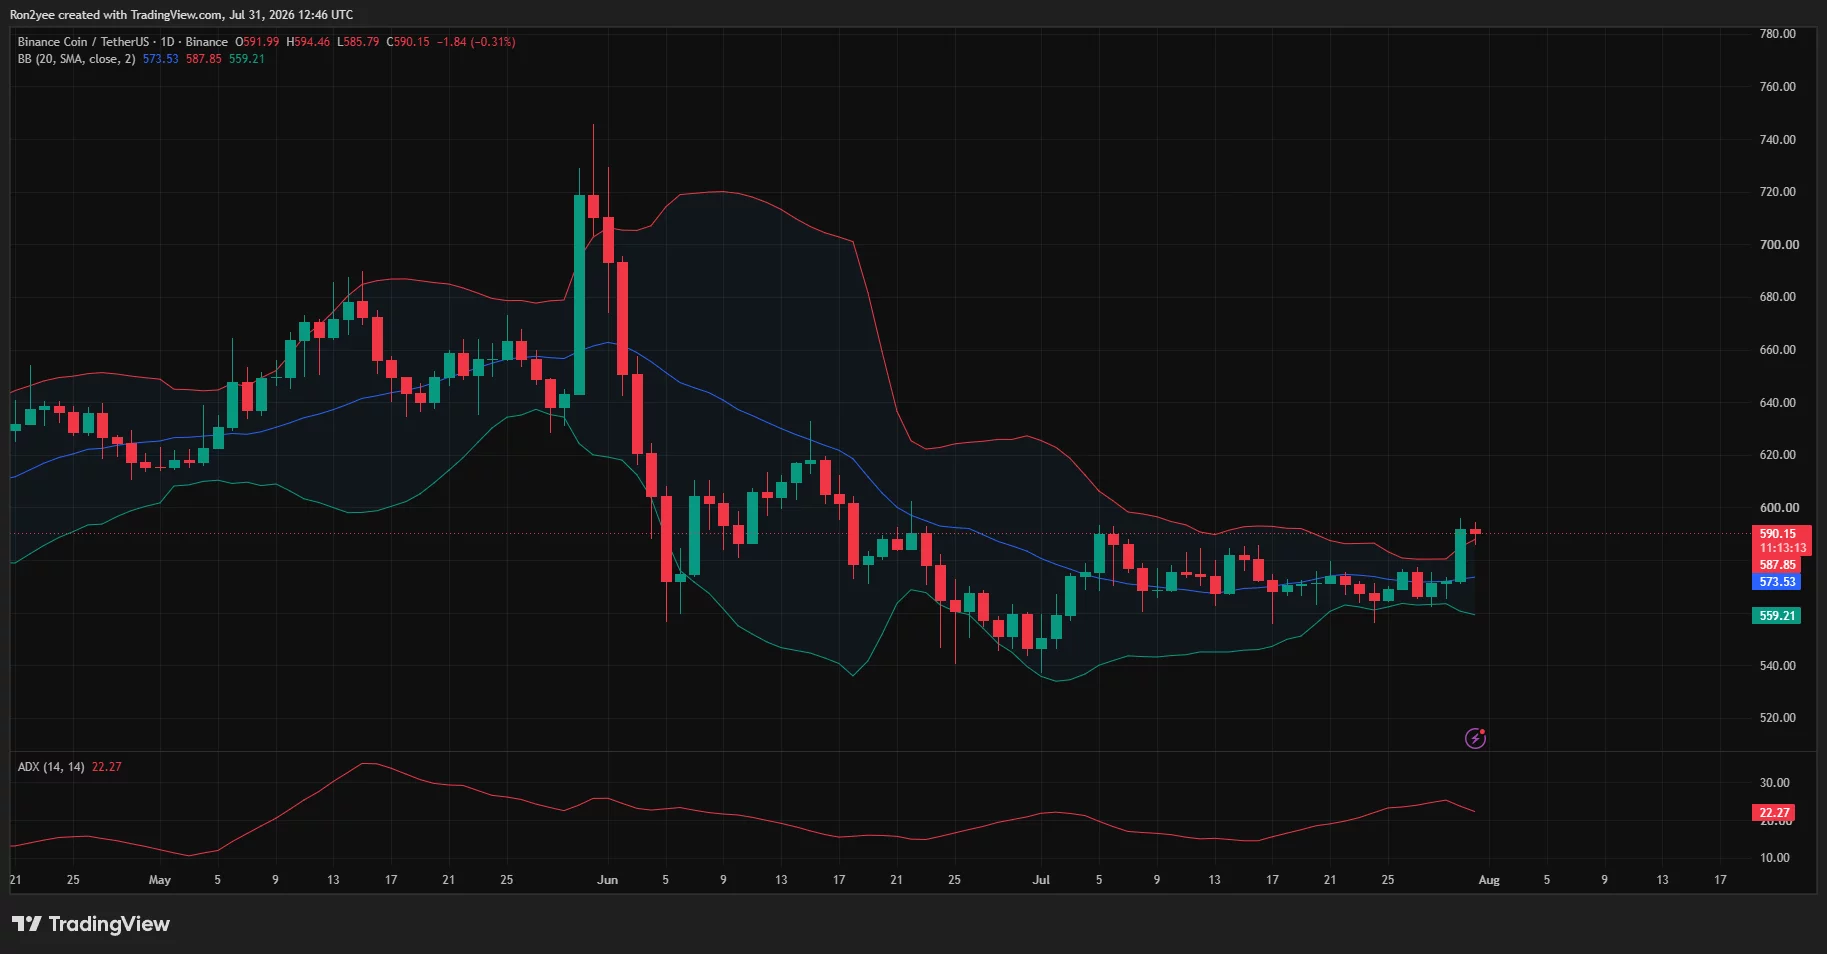
A move above the upper band reflects strong buying pressure, but it can also precede a short-term pullback when price rises too quickly. A daily close back inside the band would put $573.53 in focus as the first mean-reversion target.
The Average Directional Index stands at 22.27. That reading suggests the developing trend has moderate strength but has not yet reached the levels normally associated with a powerful directional move.
Momentum is clearer on the 4-hour timeframe. The relative strength index is at 65.14, above its moving average of 61.84 but below the overbought threshold of 70. This leaves room for another advance while warning that buyers are approaching stretched territory.
The 4-hour MACD line stands at 5.79, above the 4.33 signal line, with a positive histogram reading of 1.46. The configuration remains bullish, although the shrinking histogram bars suggest that the initial burst of momentum is beginning to cool.
Key BNB levels to watch
The 3-day liquidation heatmap identifies a dense pool of leveraged positions around $605–$610. That cluster could attract price if BNB clears $600, but it may also increase volatility as short liquidations and profit-taking occur in the same region.
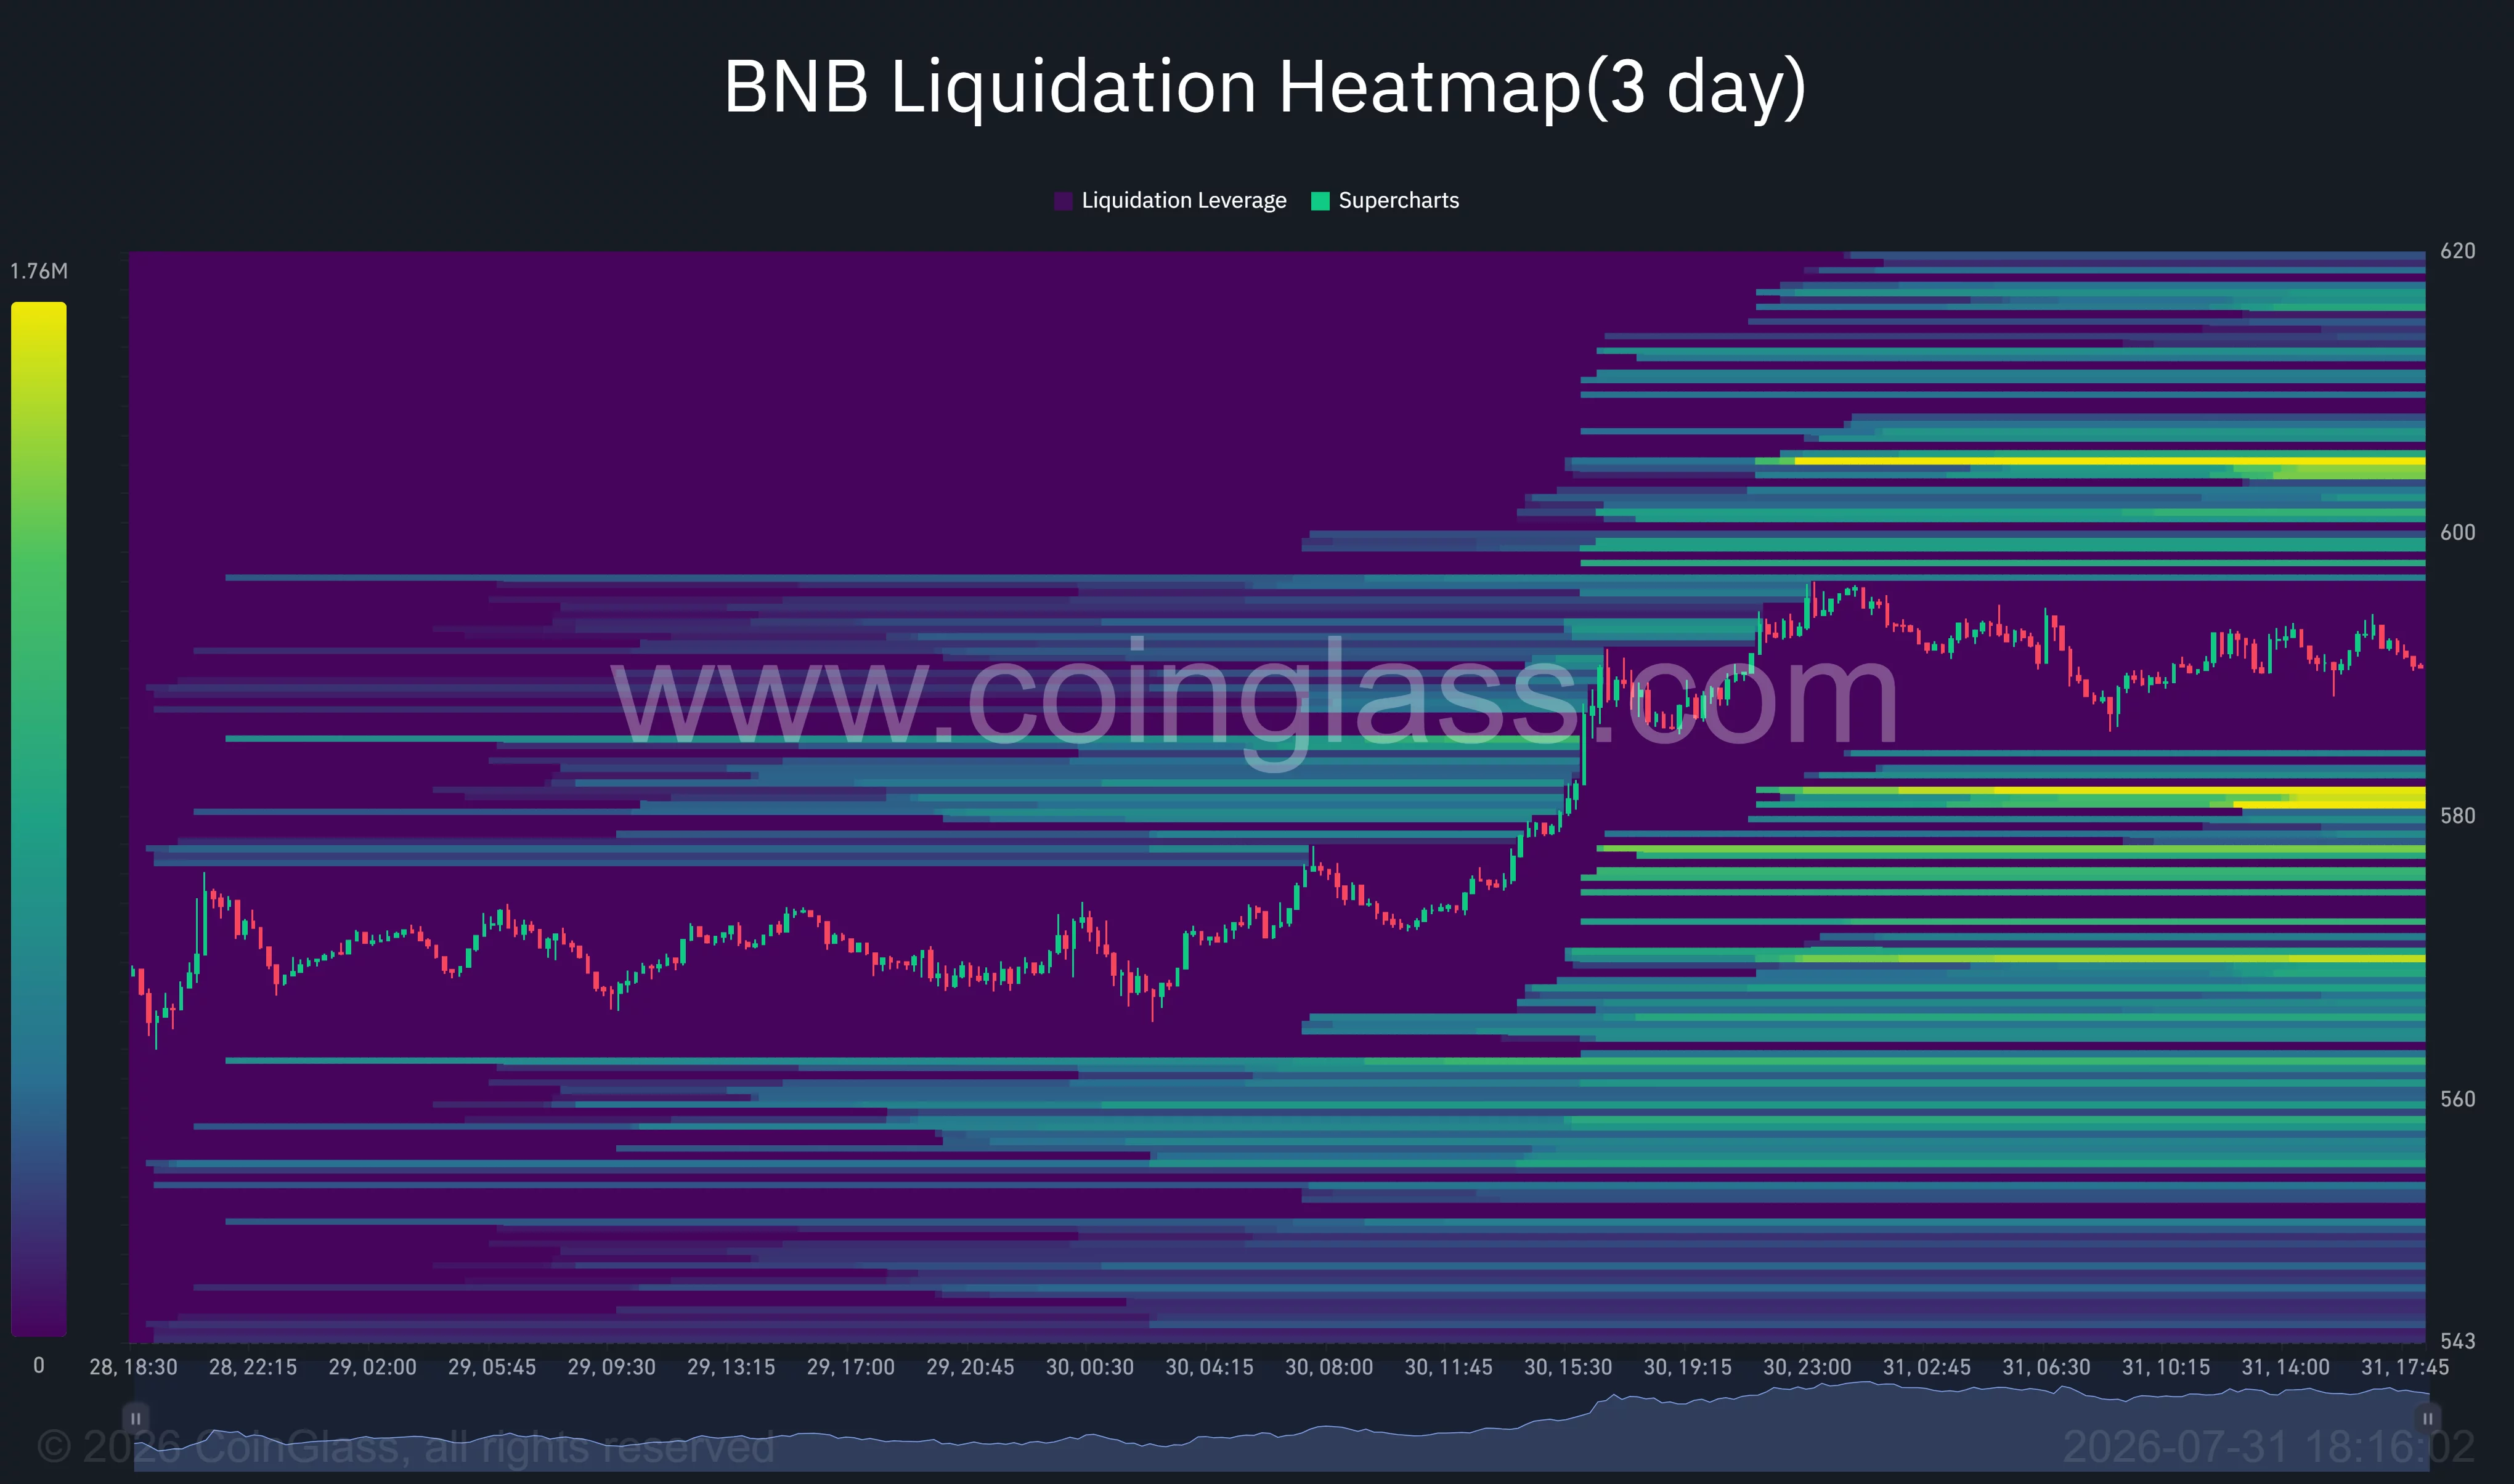
A decisive close above $610 would strengthen the breakout and open a route toward the former $620–$632 supply zone. The latter marks the high from which the descending trendline began.
Immediate support sits between $587 and $580. The heatmap shows the brightest nearby liquidity concentration around $580–$582, making that area a possible downside target if the rally loses momentum.
Below $580, the Bollinger midline near $573.53 becomes the next technical support. Losing that level would weaken the breakout and expose $559–$560, where the daily lower band aligns with July’s established demand zone.
US market context could limit the breakout
US investors are also watching broader risk appetite as geopolitical tensions and elevated energy prices keep inflation concerns in focus. Higher oil prices can complicate the Federal Reserve’s policy outlook by raising the risk that inflation remains above target.
A more restrictive interest-rate environment generally reduces liquidity available for speculative assets, including altcoins. BNB may therefore struggle to sustain an independent rally if Bitcoin and US technology stocks weaken as investors reduce risk.
The near-term setup remains constructive while BNB holds above $580. A confirmed break through $600–$610 would favor continuation, while a retreat below $573 would suggest the latest move was another failed breakout within the wider range.
Disclosure: This article does not represent investment advice. The content and materials featured on this page are for educational purposes only.
Markets,BNB,Price Analysis#BNB #price #jumps #stalls1785503549