




Ethereum price fell nearly 2% to about $1,883 on July 31 after another rejection below $2,000 weakened momentum and pushed the token toward a key technical support zone.
Summary
- Ethereum price traded near $1,883, down 1.8% on the daily chart.
- The 4-hour RSI dropped to 43.02, showing weakening short-term momentum.
- Support sits near $1,873–$1,875, with deeper liquidity around $1,850.
- Liquidation clusters near $1,935–$1,940 could attract price during a recovery.
Ethereum price action today
According to data from crypto.news, Ethereum (ETH) price extended its retreat on Thursday after buyers failed to sustain a move toward the $2,000 psychological level.
The token traded at approximately $1,883 at the time of the charts, down 1.82% on the day. ETH reached an intraday high of $1,936 before falling to a low near $1,878, showing that sellers remained active above $1,900.
Price action on the 4-hour chart shows Ethereum breaking below the middle Bollinger Band at $1,906. The move placed ETH close to the lower band at $1,875, where buyers may attempt to stabilize the decline.
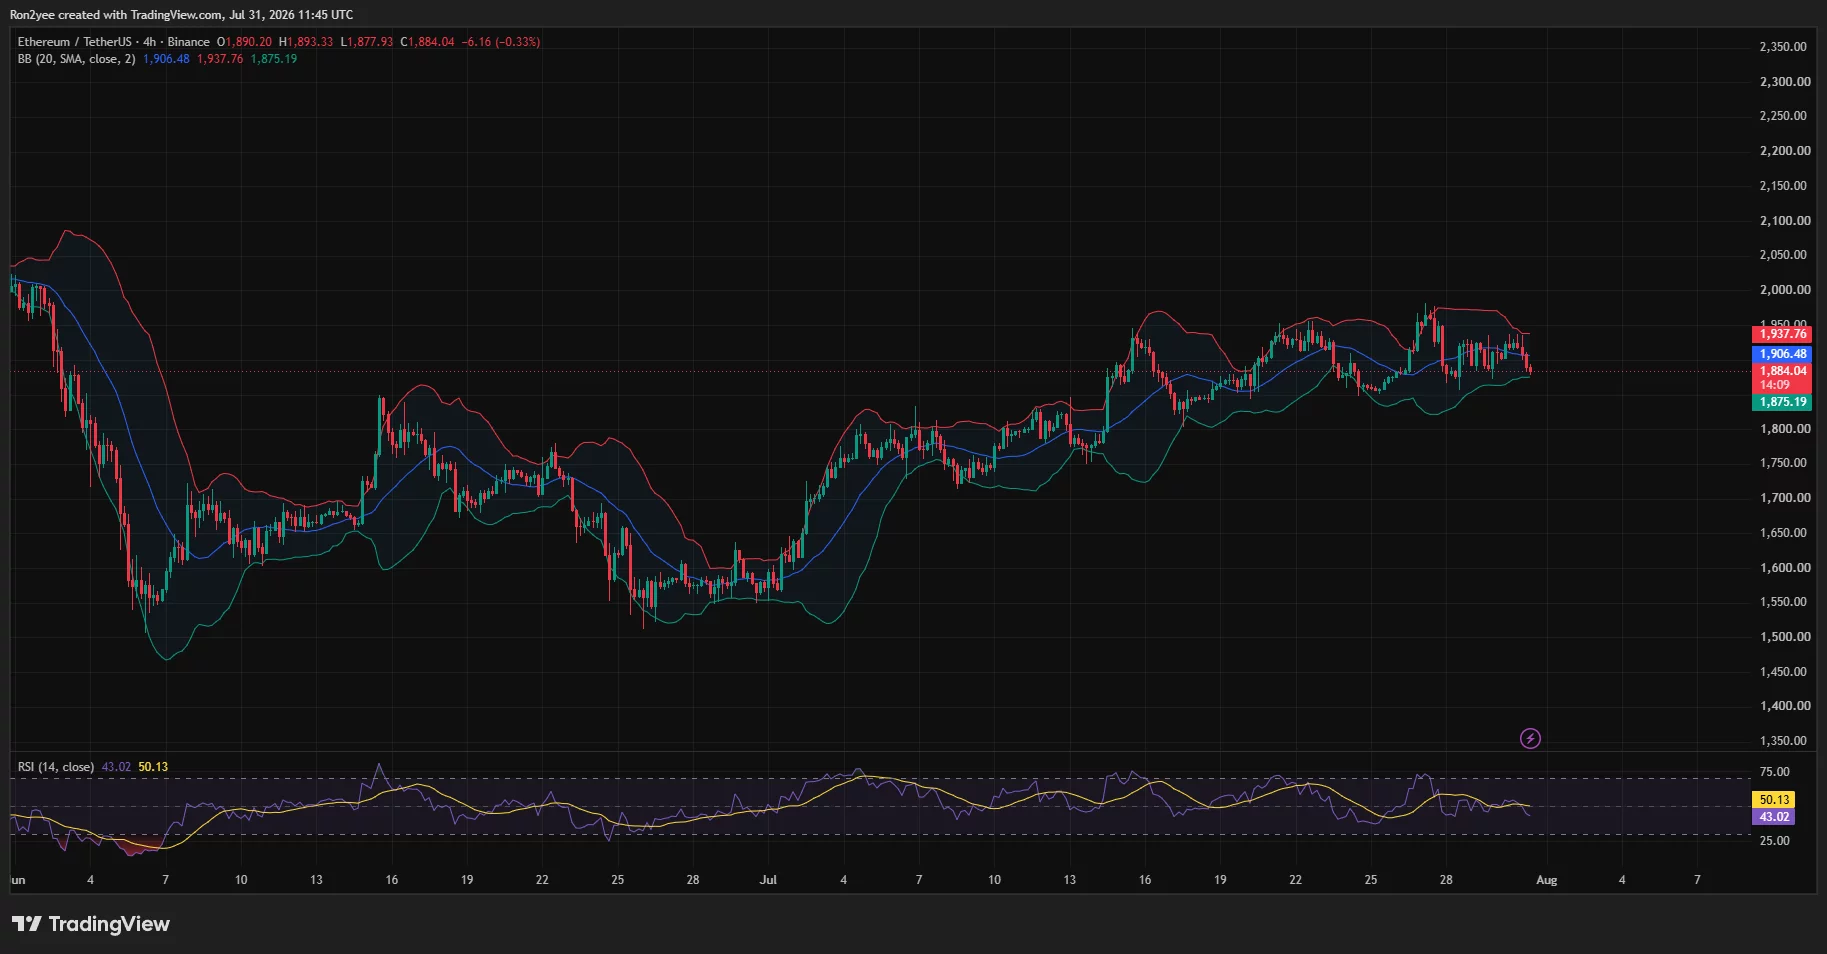
Short-term momentum has also deteriorated. The 4-hour Relative Strength Index fell to 43.02, below its moving average of 50.13. An RSI below 50 generally indicates that sellers have gained control, although the reading remains above the oversold threshold of 30.
Ethereum’s retreat follows several failed attempts to establish support above $1,930. Each rebound produced renewed selling, leaving the token inside a broader consolidation range instead of confirming a breakout.
What is driving the ETH decline?
Profit-taking near $1,950 and the continued defense of $2,000 appear to be the immediate technical drivers behind the decline.
The $2,000 level also sits close to the 50% Fibonacci retracement at $1,986.33 on the daily chart. That overlap has created a wider resistance zone where short-term traders may be closing positions rather than adding exposure.
Derivatives positioning likely amplified the pullback. The 3-day CoinGlass liquidation heatmap shows that ETH dropped sharply after trading around $1,920, passing through liquidity near $1,900 before reaching the upper $1,880s.
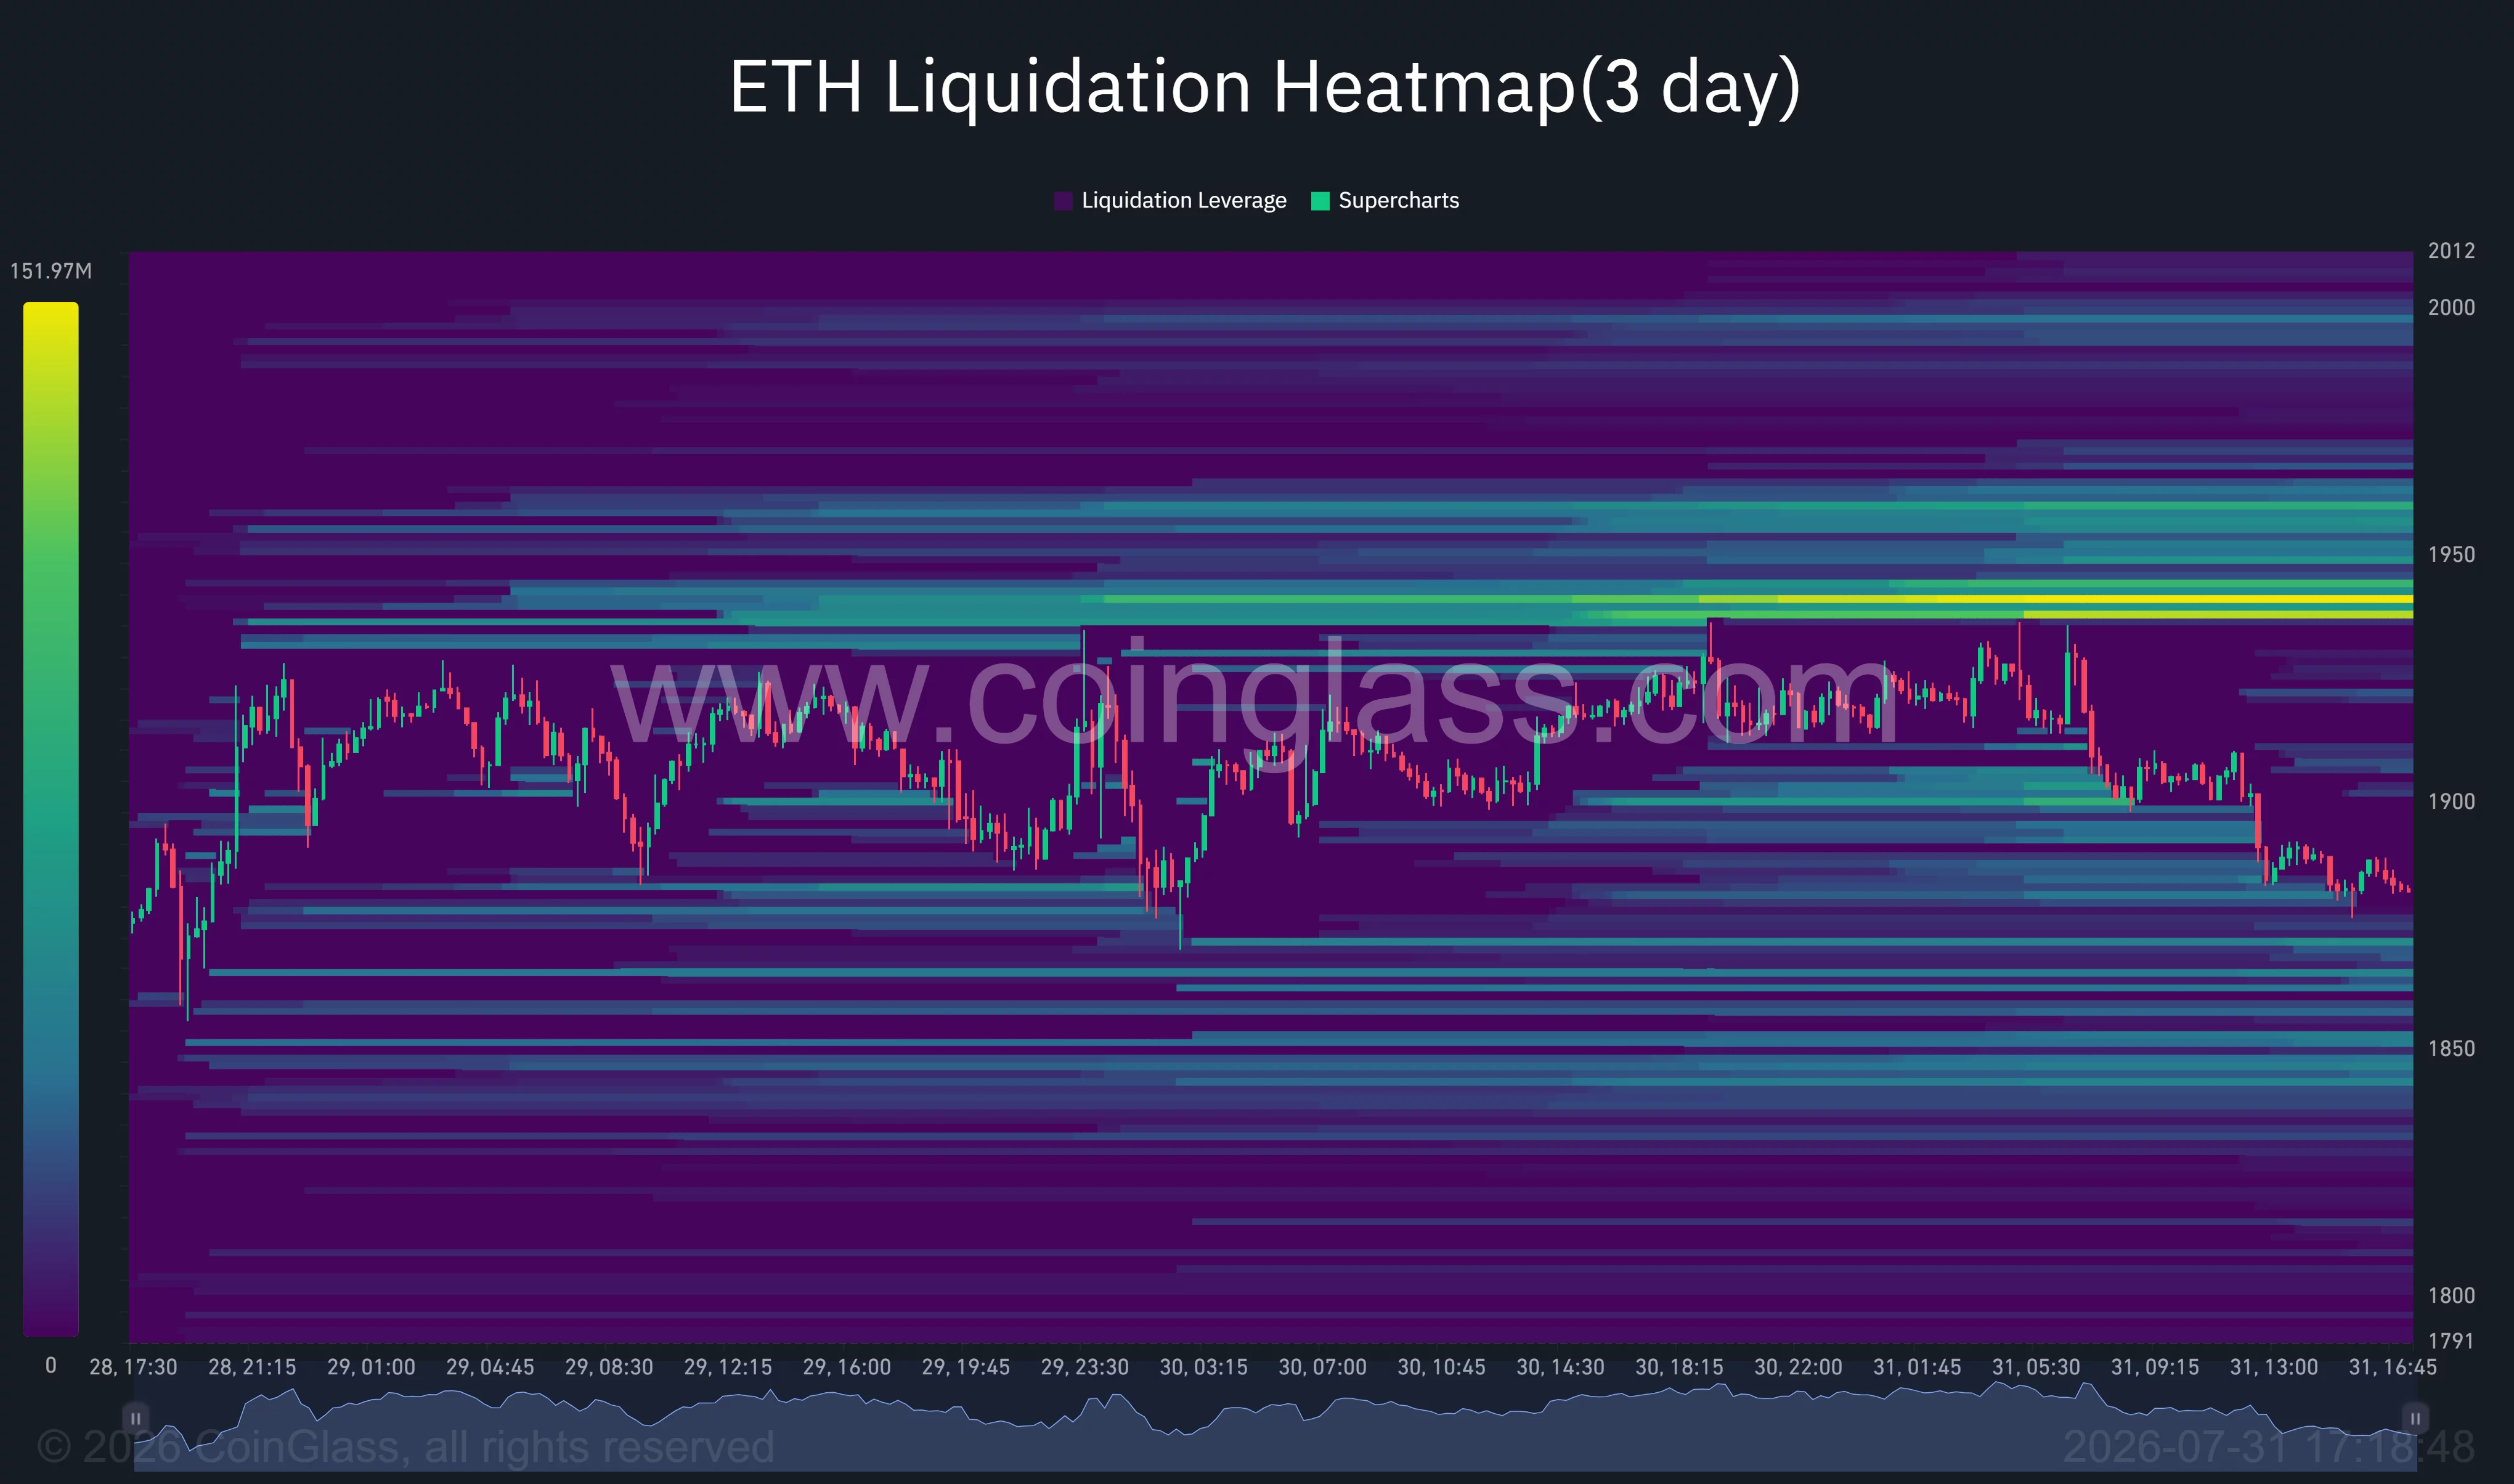
Leveraged traders who positioned for an immediate breakout above $2,000 faced pressure as the price moved in the opposite direction. Forced long closures can accelerate a decline because exchanges sell the underlying position when margin requirements are no longer met.
Broader conditions remain challenging for risk assets. The Federal Reserve’s decision to maintain elevated interest rates has kept financing conditions restrictive for US investors, while geopolitical uncertainty in the Middle East has supported a more defensive market posture.
Ethereum has also lacked the sustained spot demand needed to separate from those macro pressures. Weak on-chain activity and redemptions from spot Ethereum exchange-traded products have reduced two potential sources of buying support.
Ethereum support at $1,873 faces a test
Ethereum is now testing an important technical area between $1,873 and $1,875.
The daily chart places the 0.618 Fibonacci retracement at $1,873.50, while the 4-hour lower Bollinger Band stands at $1,875.19. The convergence makes this range the first level bulls need to defend.
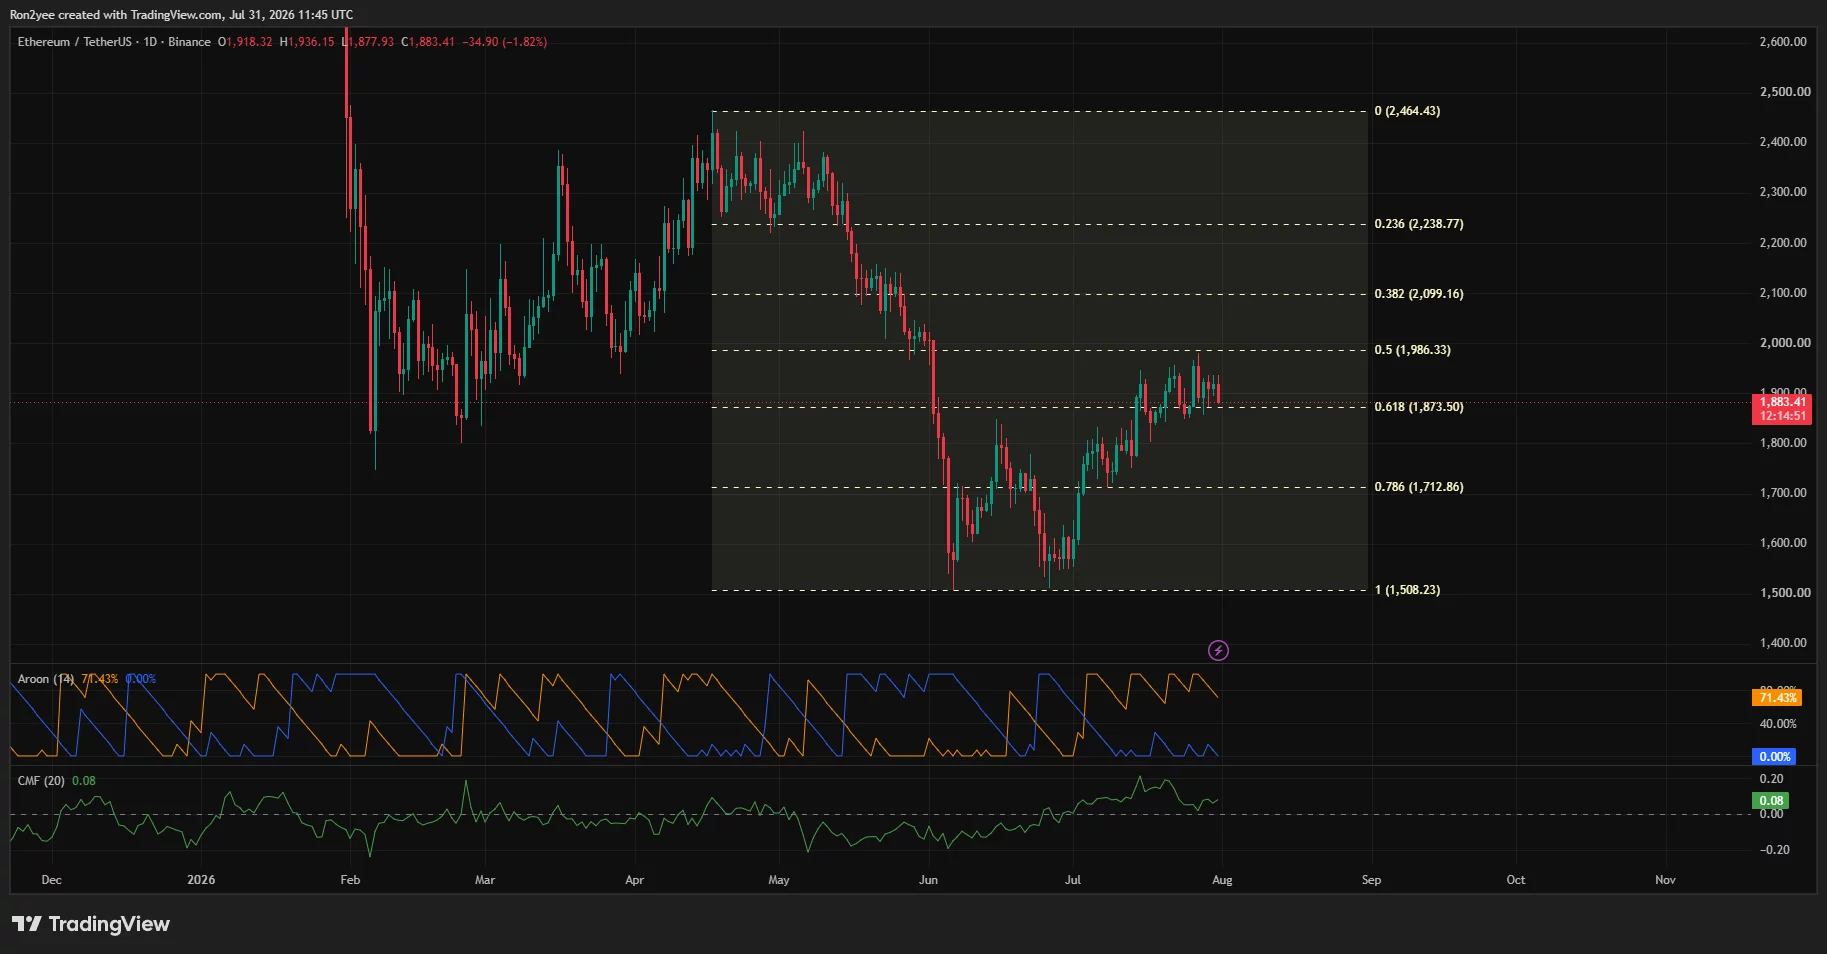
A daily close below $1,873 would weaken the recovery structure that developed from the late-June low. The liquidation heatmap points to additional liquidity between approximately $1,850 and $1,870, making that area the next potential downside target.
Below $1,850, attention would shift toward $1,800. Losing that psychological support could expose the 0.786 Fibonacci retracement at $1,712.86, although ETH would need a much deeper correction to test that level.
Some longer-term indicators remain constructive. Chaikin Money Flow stood at 0.08 on the daily chart, suggesting capital flows were still marginally positive despite the price decline. The Aroon readings also showed Aroon Up at 71.43 and Aroon Down at zero, indicating that the broader July recovery had not been fully invalidated.
Those signals contrast with the weaker 4-hour RSI, showing a market in which the medium-term recovery remains intact but near-term momentum favors sellers.
Liquidation heatmap points to $1,940 resistance
The largest nearby concentration of liquidation leverage sits around $1,935–$1,940, according to the 3-day heatmap.
That cluster could act as a price magnet if Ethereum rebounds from current support. A recovery above $1,906, the middle Bollinger Band, would be the first indication that short-term momentum is improving.
ETH would then face resistance at $1,938, which marks the upper Bollinger Band and overlaps with the main liquidation pocket. Clearing that area could open another test of $1,986 and $2,000.
Additional liquidity appears near $1,950–$1,965 and immediately below $2,000. These clusters could fuel a short squeeze if buyers reclaim $1,940, but they may also attract fresh selling as traders defend the wider resistance zone.
Failure to recover $1,900 would keep the downside scenario active. In that case, leveraged positions accumulated around $1,875 and $1,850 could become vulnerable.
What analysts are saying about Ethereum
Crypto analyst Michaël van de Poppe described the current decline as a lower-timeframe correction while maintaining a positive longer-term view.
“ETH is holding above $1,800 and as long as that’s the case, there’s not much to worry,” van de Poppe said. He added that he still expects Ethereum to reach $2,500 in the coming months.
Analyst Ted Pillows identified a narrower support range. He said momentum was weakening after ETH fell below $1,900 but noted that the token remained above its $1,850 support zone.
“As long as it holds, I think ETH is more likely to rally towards $2,000.”
The charts therefore place Ethereum at a decision point. Holding $1,873–$1,850 would preserve the possibility of another move toward $1,940 and $2,000. A sustained breakdown below that range would instead reinforce the rejection and raise the risk of a deeper pullback toward $1,800.
Disclosure: This article does not represent investment advice. The content and materials featured on this page are for educational purposes only.


Markets,Ethereum,Federal Reserve,interest rates,Price Analysis#Ethereum #price #tumbles #hold1785499881