


Solana price has held above the key $80 support zone despite mounting selling pressure, with one analyst arguing the level could determine whether the token begins a new recovery phase or enters a deeper bear market decline.
Summary
- Solana price has fallen toward the key $80 support zone after retreating from its May high near $98.
- Crypto analyst Scient said holding the $79–$80 range could keep the door open for a move toward $100–$120.
- A break below major support could trigger a deeper correction, while reclaiming $98 may revive bullish momentum.
According to data from crypto.news, Solana (SOL) price was trading near $82 on May 29 after briefly falling toward the $80 region during a broader crypto market correction.
The token remains down roughly 16% from its May high near $98 as traders continue to react to macroeconomic uncertainty, whale selling activity, and renewed geopolitical tensions in the Middle East.
Solana’s ongoing drop coincided with a sharp risk-off move across digital assets after Bitcoin (BTC) slipped below $73,000 and Ethereum (ETH) briefly traded under $2,000. Concerns over potential disruptions to shipping routes through the Strait of Hormuz pushed Brent crude oil prices higher this week, reviving inflation fears and reducing demand for speculative assets.
On-chain activity has added further pressure. As reported earlier by crypto.news Memecoin launchpad Pump.fun recently transferred more than 100,000 SOL worth roughly $8.3 million to Kraken. The move followed reports that a long-term Solana whale had unstaked and sold more than $137 million worth of SOL, adding significant supply to the market during an already fragile period.
Despite those headwinds, some analysts believe Solana remains at a pivotal technical level that could determine the direction of the next major move.
Can Solana defend a multi-year support zone near $80?
According to analyst Scient, the most important area on Solana’s weekly chart remains the range between $79 and $80, which coincides with the 2024 cycle low.
“The $79-$80 is the level for SOL. Hold it and the setup remains intact. Lose it and price likely revisits the mid $20s.”
The analyst highlighted a broader multi-year structure stretching back to the previous bull cycle. Solana has attempted to break above the $210 region on three separate occasions since 2021 but has failed each time. Following the latest rejection near that level in late 2025, SOL price returned to the lower end of the range where buyers have repeatedly stepped in.
Scient argued that current price action resembles accumulation rather than a confirmed breakdown. The analyst noted that SOL continues to trade above long-term support despite months of volatility and suggested the current range could serve as the foundation for another breakout attempt if buyers maintain control.
The weekly chart also shows SOL trading near the lower boundary of a large consolidation range that has contained price action for more than a year.
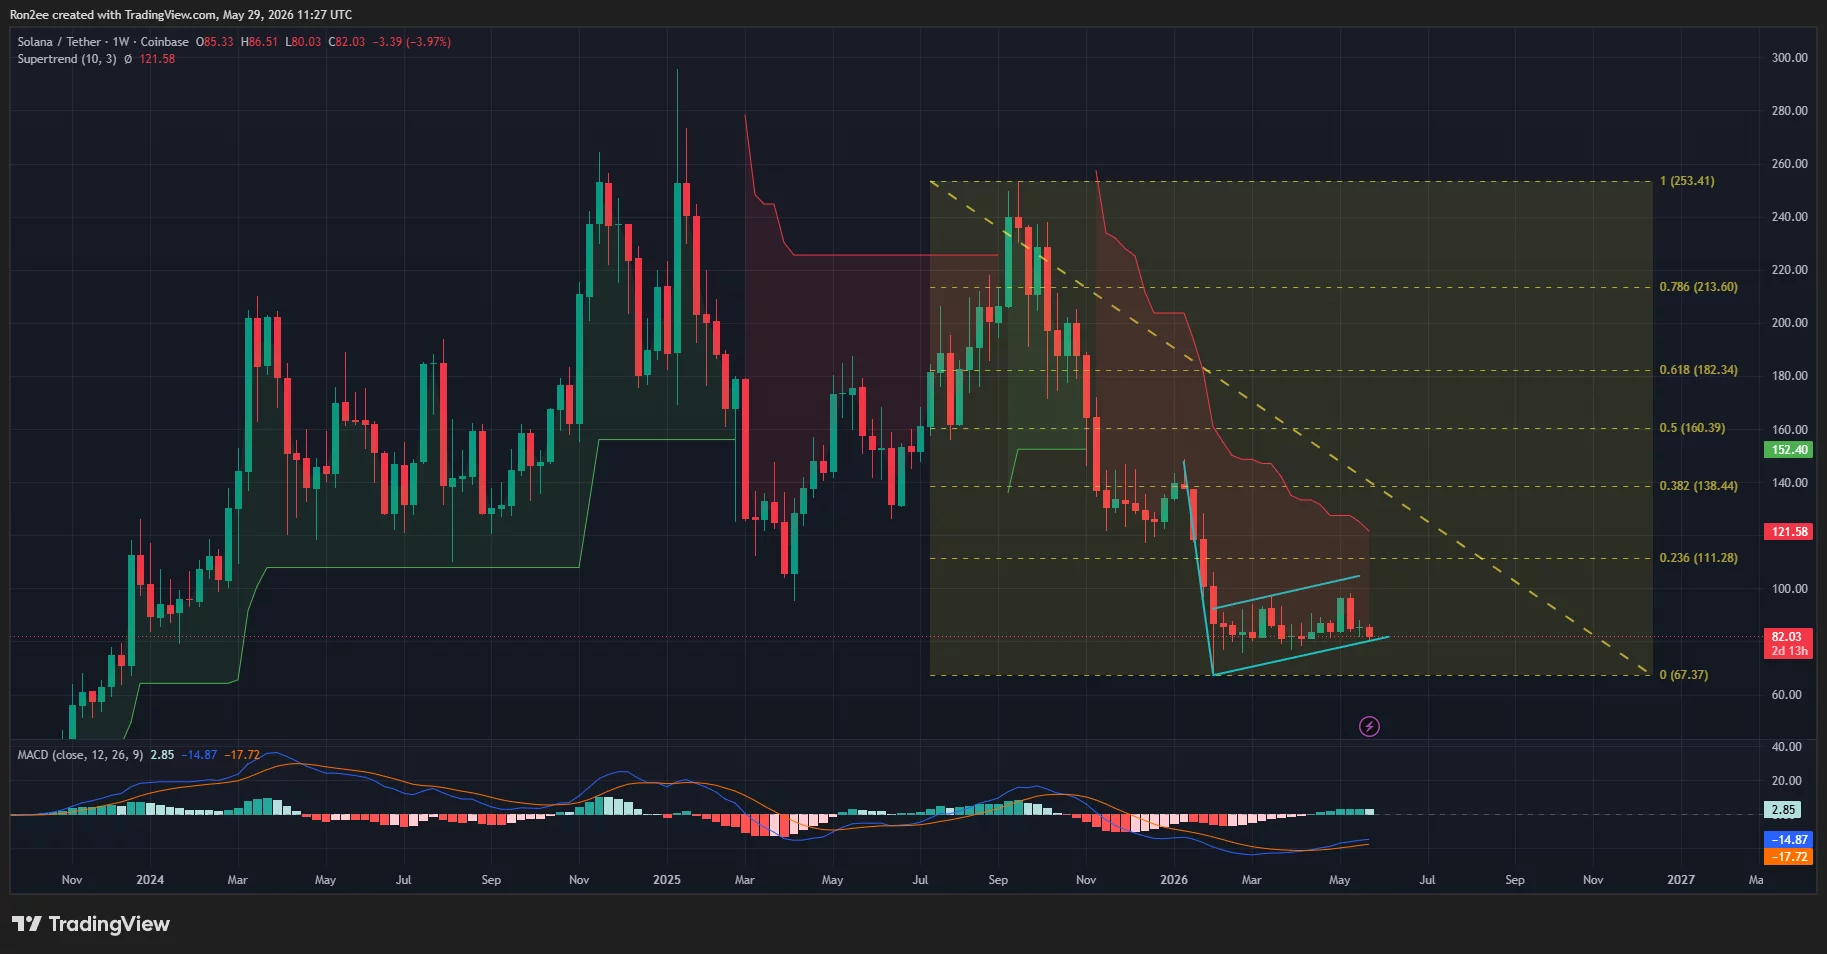
While the token remains well below the 0.236 Fibonacci retracement level near $111 and the weekly Supertrend resistance around $121, the $79-$80 support area has continued to attract buyers during repeated selloffs.
According to analysts at More Crypto Online, Solana could decline toward $62 if it fails to hold the key $72–$78 support zone. Conversely, a rebound above the May 12 high near $98 could pave the way for a move toward the $110 level.
Institutional sentiment toward Solana has remained mixed. Reports that Goldman Sachs liquidated its Solana ETF exposure earlier this year removed a notable source of institutional demand, while several asset managers continue pursuing crypto-related investment products tied to major layer-1 networks.
Traders have increasingly focused on whether fresh institutional participation emerges if market conditions stabilize during the second half of the year.
What technical risks could invalidate the bullish thesis?
The daily chart presents a more cautious picture. Solana price recently formed a bearish double-top pattern after failing twice near the $98 resistance area, first in March and again in May. The structure developed as momentum weakened across the recovery rally and sellers repeatedly defended the same overhead resistance zone.
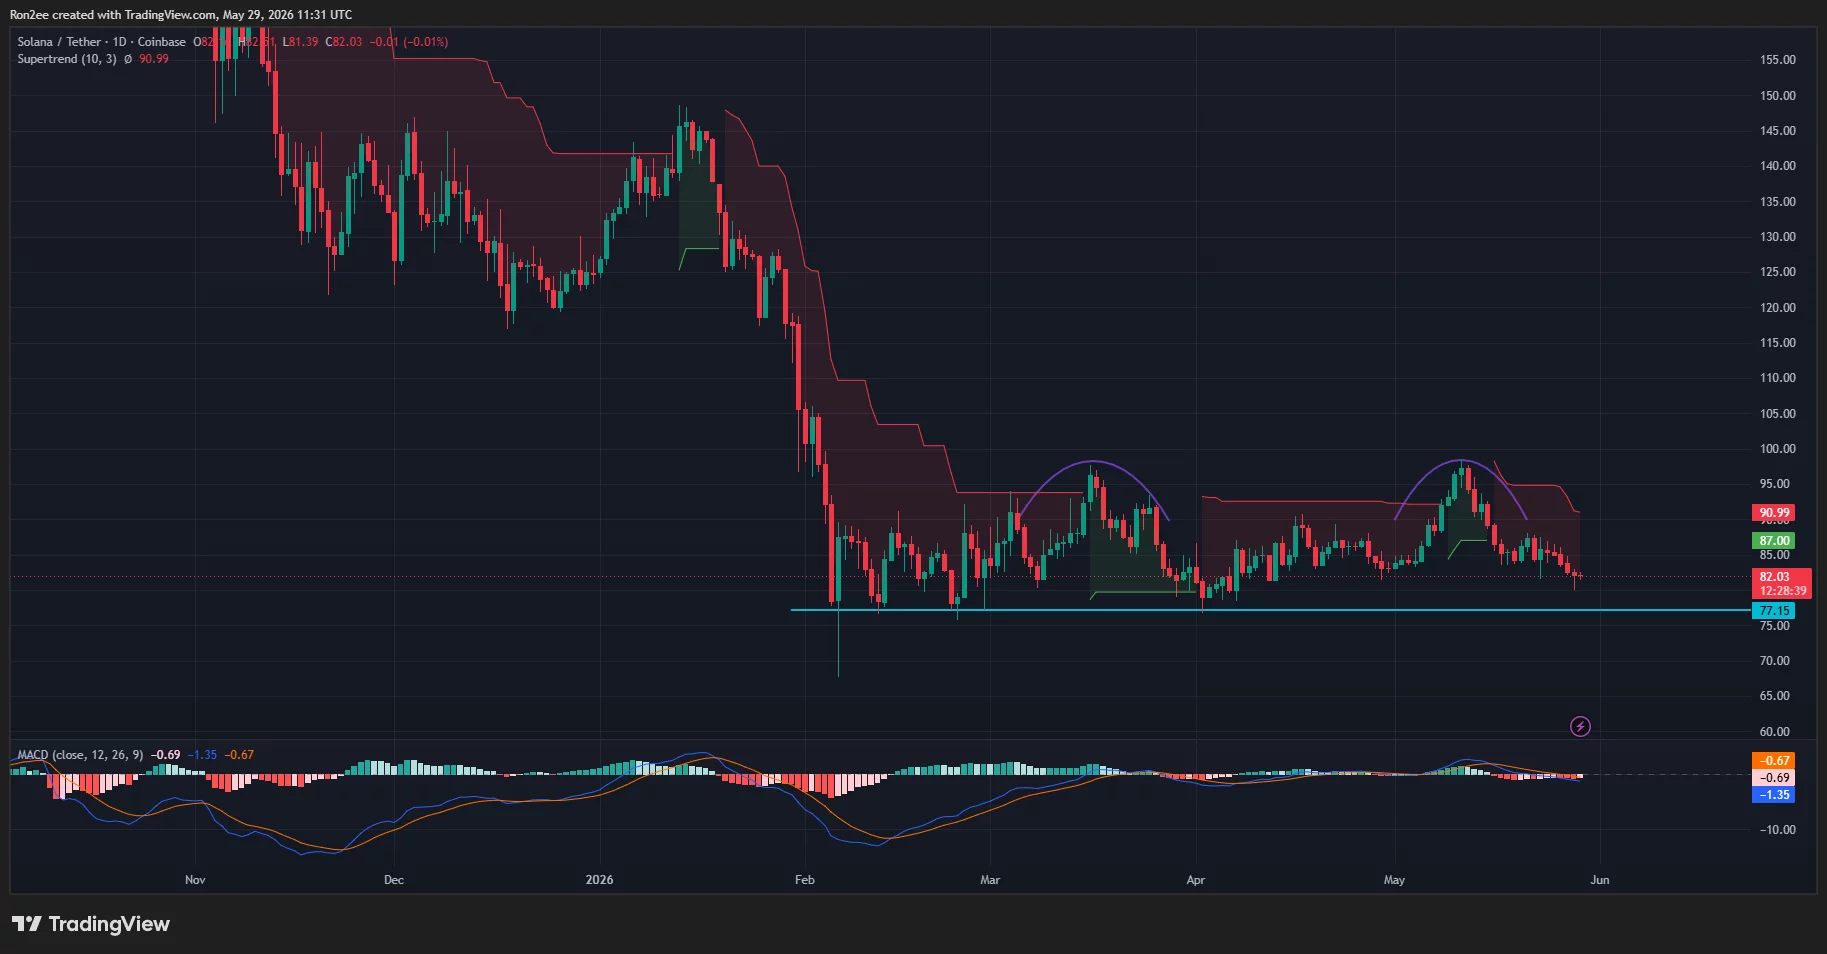
The chart shows that SOL has already fallen below several short-term support levels near $90 and $85. The daily Supertrend indicator remains bearish around $91, while the MACD has crossed lower and continues to trend below its signal line.
A separate longer-term chart structure also warrants attention. The weekly timeframe shows SOL trading inside what appears to be a bearish flag formation following its collapse from the 2025 highs.
Technical analysis treats such formations as continuation patterns, with breakdowns often producing another leg lower in the direction of the previous trend.
Derivatives positioning remains defensive as well. Open interest across Solana perpetual futures has declined during the recent correction, suggesting traders have reduced leveraged long exposure rather than adding new bullish bets.
Funding rates on several major exchanges have remained negative, showing that short sellers continue to dominate positioning.
CoinGlass liquidation data highlights another important battleground around current prices. A large cluster of leveraged positions sits near the $80 level, making it one of the most significant liquidity zones on the chart. Additional liquidation pools are concentrated around $84, $85, and $86, where short sellers could face pressure if price stages a recovery.
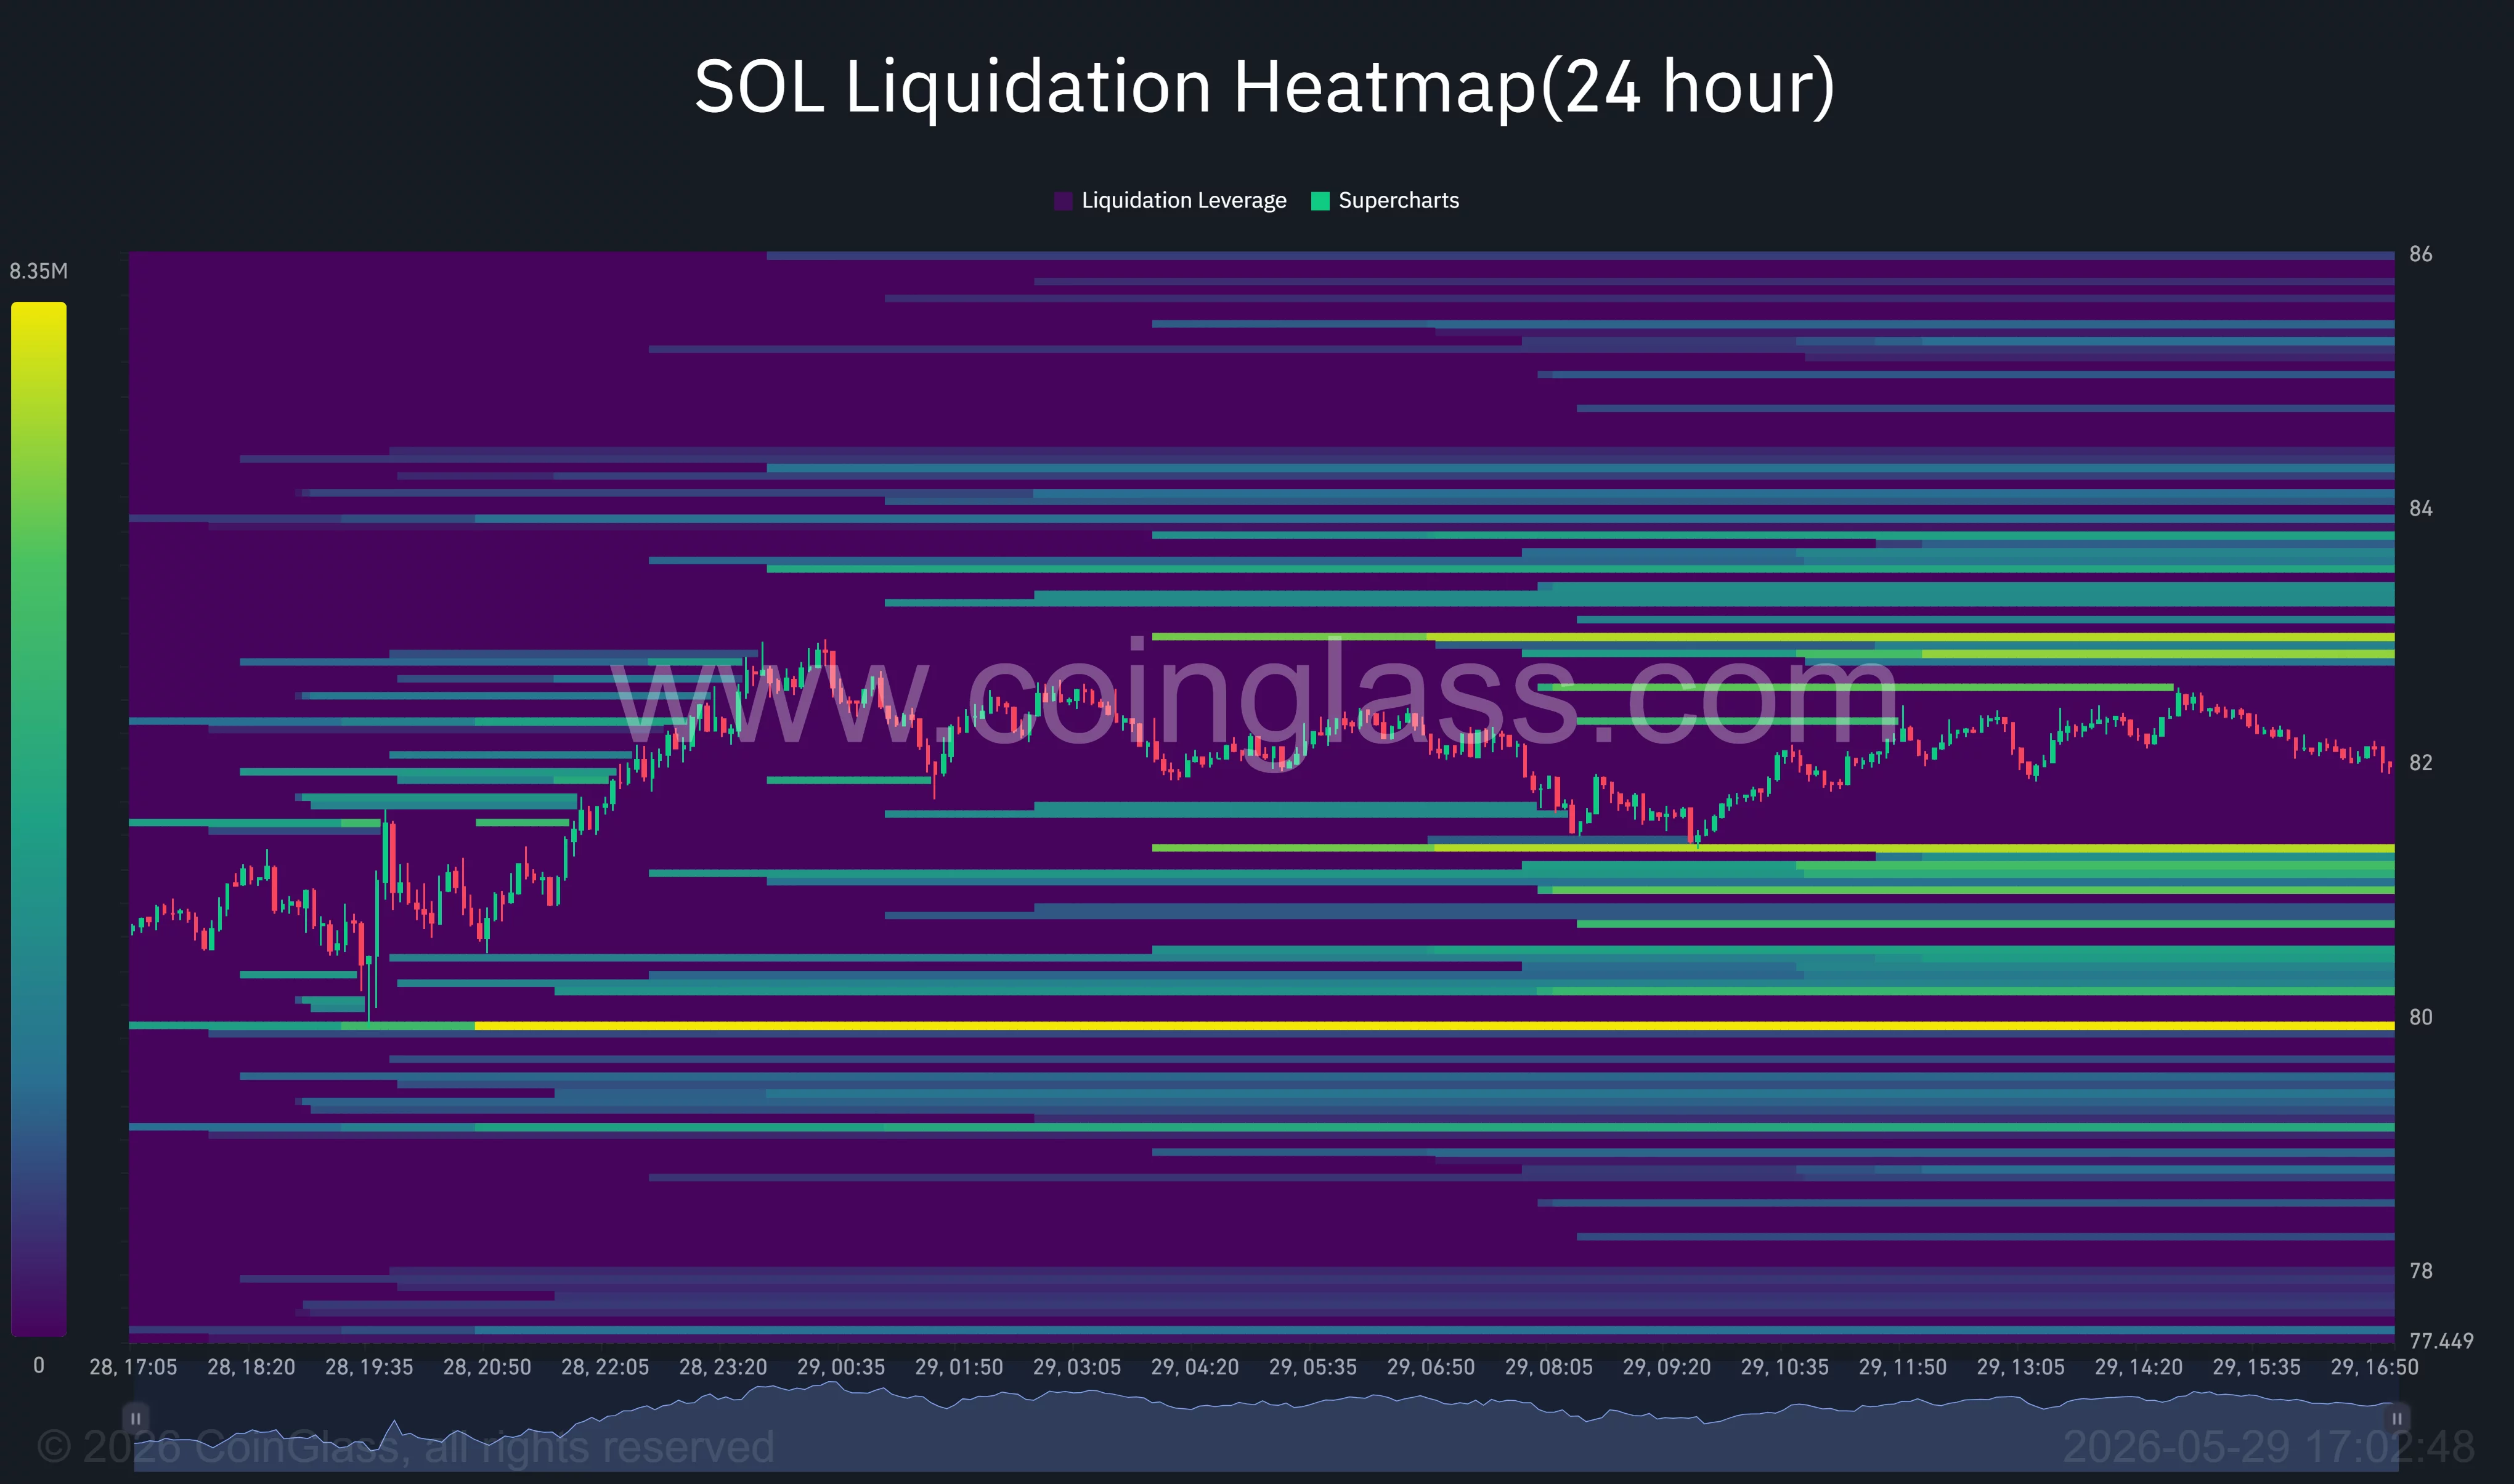
The heatmap suggests volatility could increase sharply if SOL breaks away from its current range. A move below $80 could trigger another wave of long liquidations and expose support near the $75-$77 region. Conversely, a recovery above $84 may force short-covering activity and create room for a move toward the $88 resistance cluster.
Macro conditions remain another source of uncertainty. Elevated oil prices have complicated expectations for Federal Reserve rate cuts later this year, particularly after recent inflation data showed price pressures remain stubbornly above target.
Higher borrowing costs and tighter financial conditions have historically weighed on high-beta cryptocurrencies such as Solana.
For now, traders appear focused on a single level. While daily charts continue to show a bearish double-top structure and weekly charts hint at a larger bearish flag, Scient’s thesis remains valid as long as the $79-$80 support zone survives.
Holding that area could allow buyers to target a recovery toward $100 and potentially $120, where volume profile data shows relatively limited resistance.
A decisive break beneath support, however, would invalidate the accumulation narrative and shift attention toward deeper downside targets that some analysts believe could extend well below the current trading range.
Disclosure: This article does not represent investment advice. The content and materials featured on this page are for educational purposes only.


Markets#Solana #price #hold #support #fuel #leg #higher #analyst1780057743